GitScope
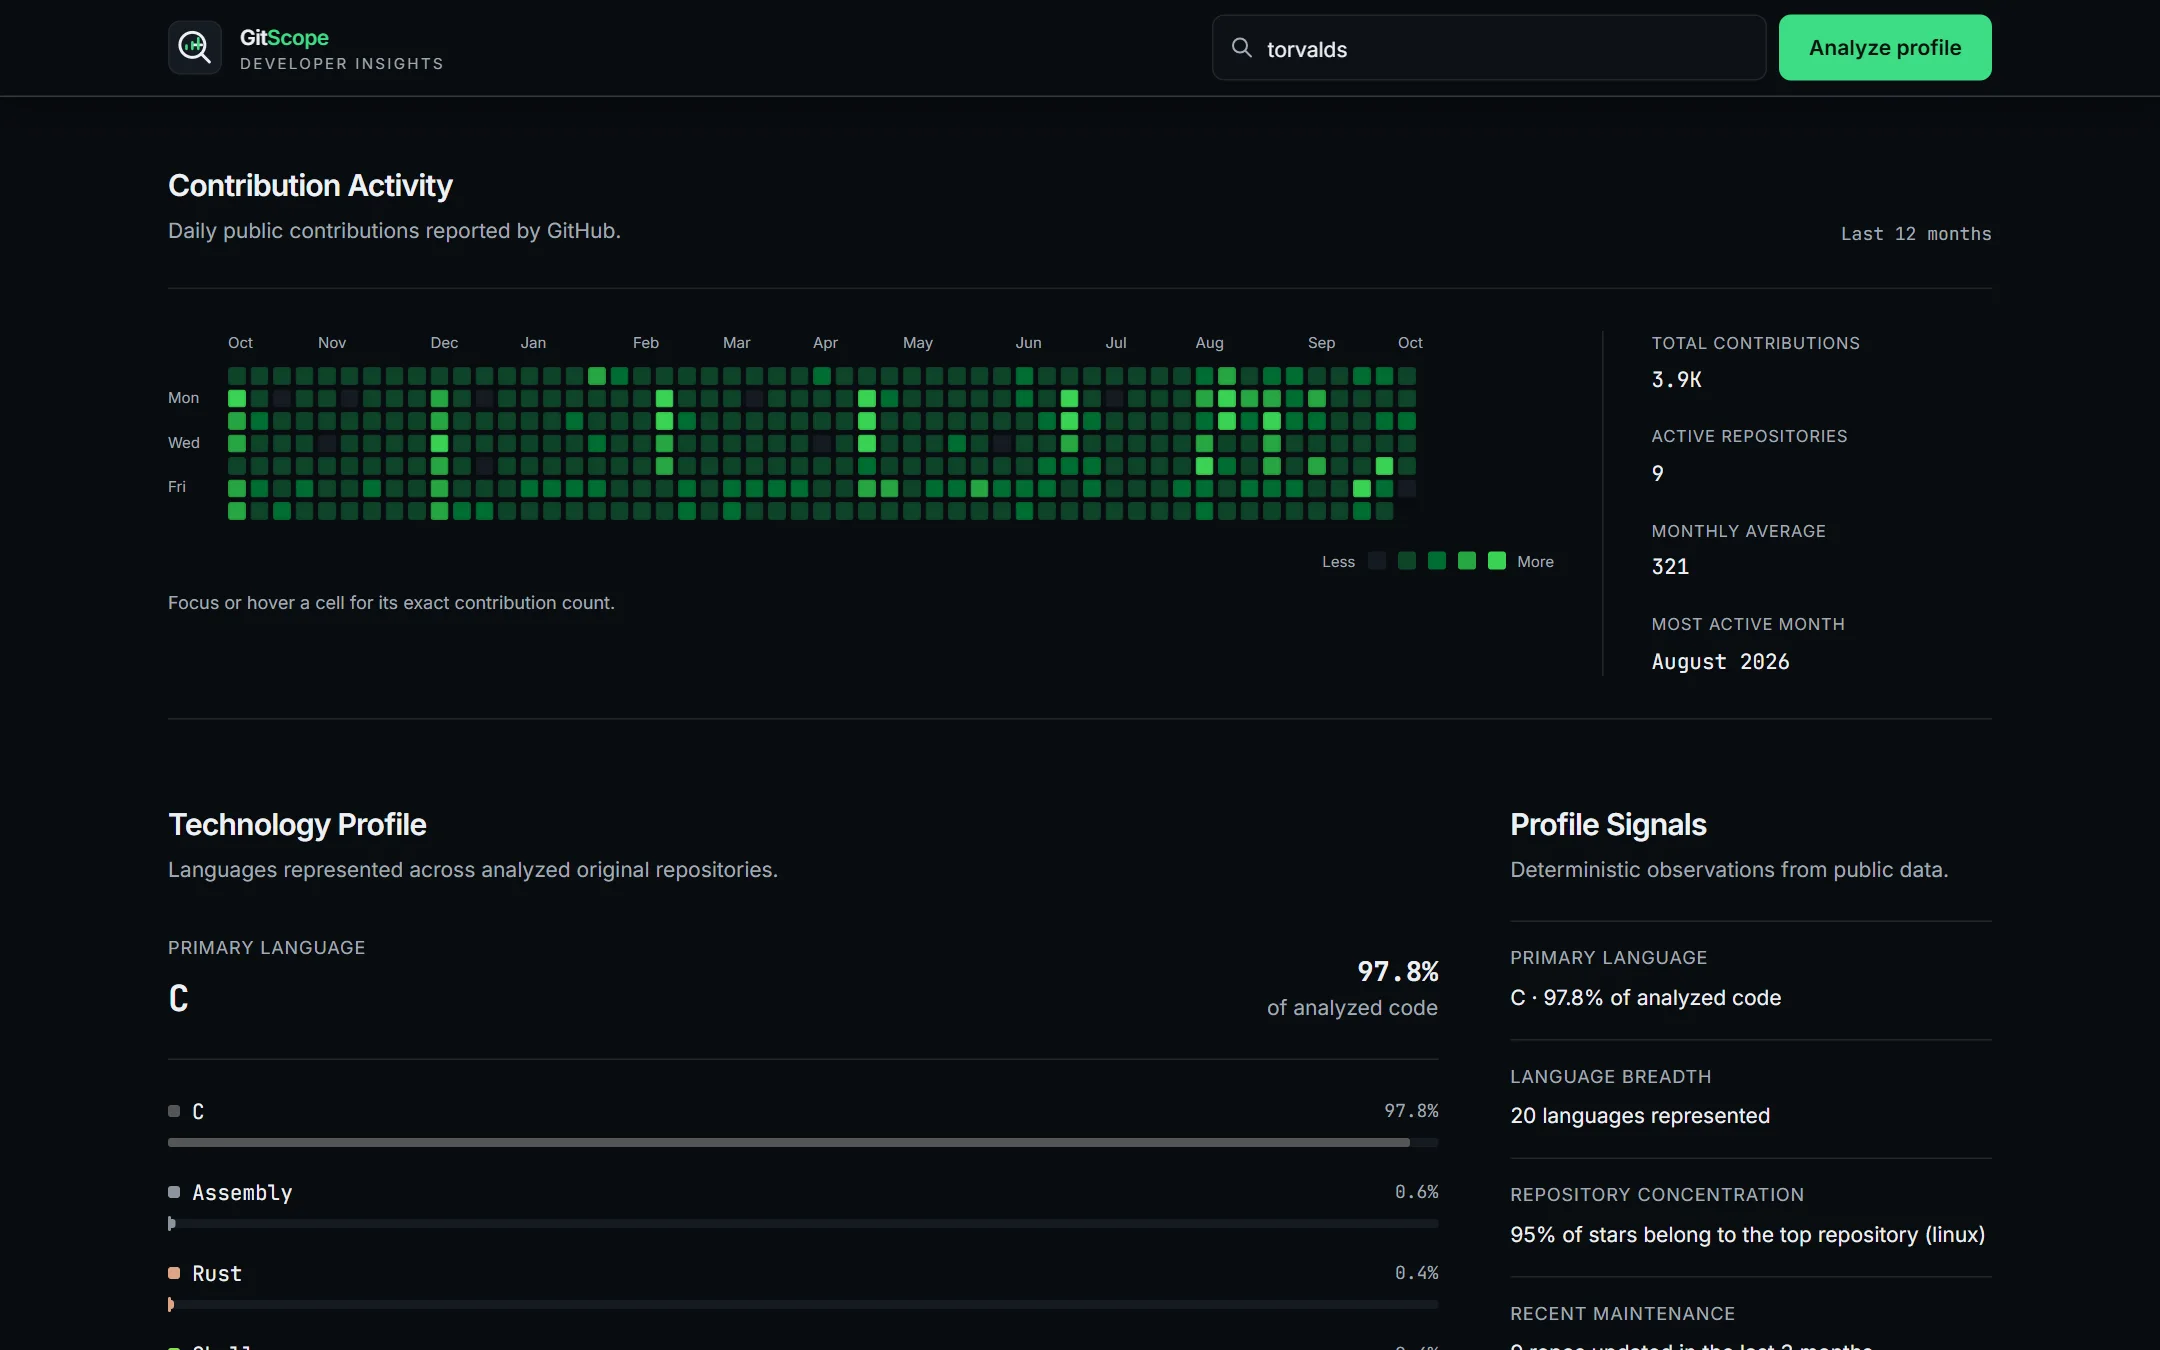
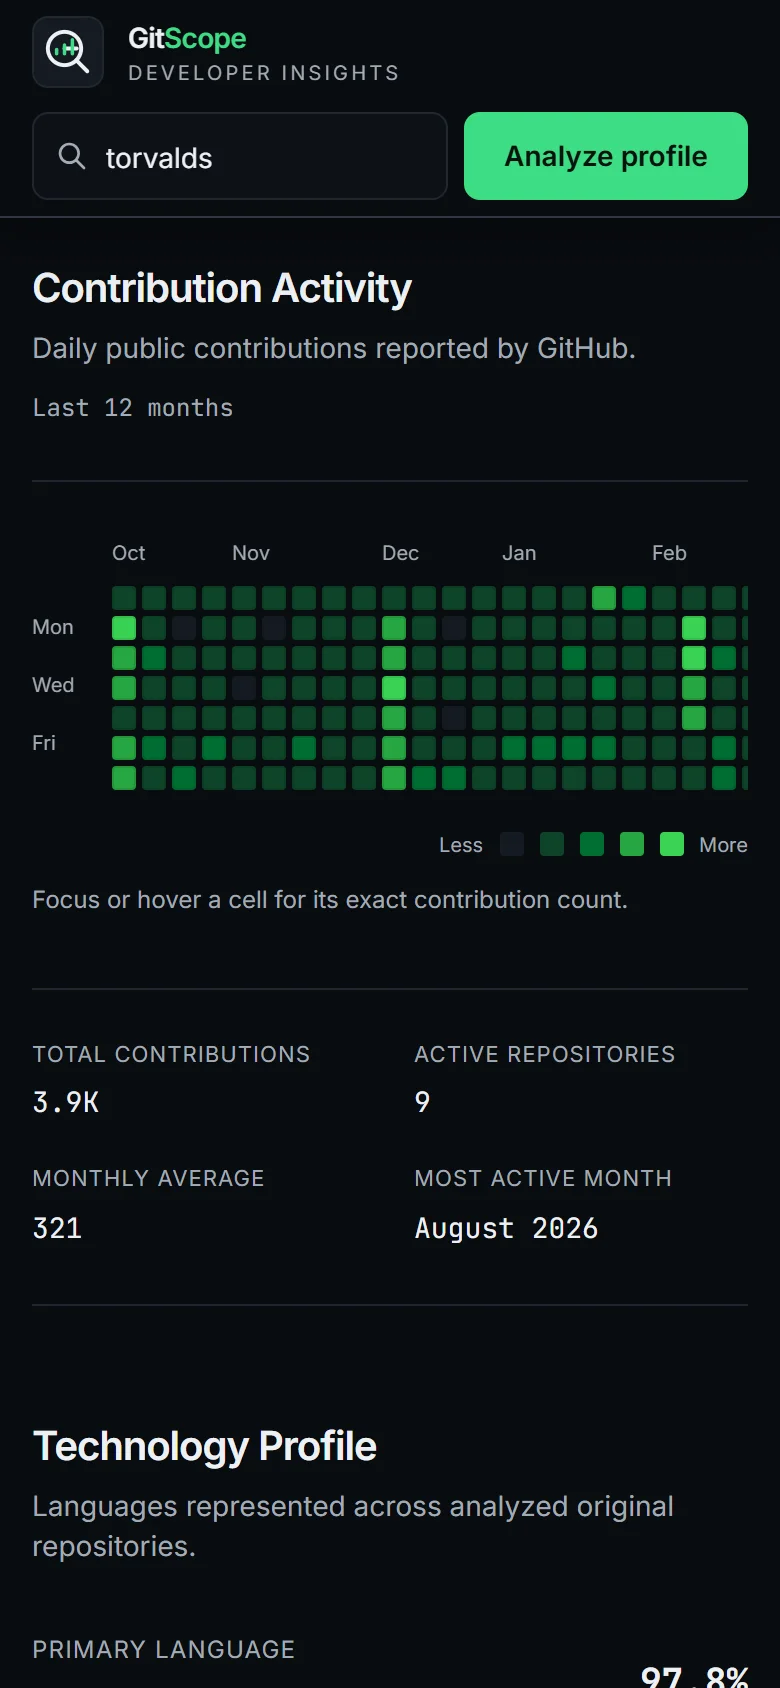
GitScope reads a public GitHub profile and summarises it on one page: how active, in which technologies, and where the work lives.
- Role
- Product design · Frontend engineering
- Year
- 2026
- Team
- Solo
- Stack
- Next.js · TypeScript · Tailwind CSS · Recharts · GitHub REST API
Overview
- Problem
- GitHub spreads a profile across separate pages: contributions in one place, repositories in another, languages per repository. Understanding someone’s work means clicking through all of it.
- Approach
- I designed a single overview that answers the broad questions first (how active, in which technologies, how recently) and keeps repository detail below it, searchable and sortable.
- Result
- A live dashboard for any public profile, with a shareable URL and share preview for each one. The code is open source.
Decisions
D1Overview first, detail second.
Why: Someone opening a profile wants its shape before its parts. Activity totals, the contribution calendar, and the technology profile come first; the repository table comes after.
Trade-off
Anyone looking for one specific repository scrolls past the summary to reach the table.
D2Use GitHub’s real contribution calendar, and label the fallback.
Why: The REST API doesn’t expose contribution counts, so GitScope reads the public calendar GitHub renders on profile pages. If that can’t be read, the chart falls back to repository update dates and changes its title to “Public Repository Activity”, with a note, so an estimate is never shown as GitHub’s count.
Trade-off
The calendar page isn’t a formal API. If GitHub changes its markup, the fallback keeps the page working until the parser is updated.
D3Count original work only.
Why: Forks contain other people’s code. Language share, stars, and recent activity are all calculated from original repositories, so the numbers describe the person, not the projects they’ve forked.
Trade-off
Work done inside a fork doesn’t appear in the totals.
From username to page
Every GitHub request runs on the server in a Server Action, so the optional access token never reaches the browser. A search moves through five steps.
Validate
The username is trimmed, stripped of a leading @, and checked against GitHub’s username rules before any request is made.
Fetch
The profile and up to 100 most recently updated repositories, cached for an hour. If a configured token is rejected, the request retries anonymously instead of failing.
Enrich
Languages for the ten most recently updated original repositories, fetched in parallel with a five-second limit each and twenty seconds overall. Anything later is dropped, and the page renders with what arrived.
Transform
Transformers turn raw API responses into exactly what the interface needs: language share, activity score, repository staleness, and the most active month.
Render
Components receive prepared data, so charts and tables contain presentation logic only.
When GitHub’s rate limit is reached, the error message says how many minutes remain until it resets.
Outcome
What shipped
- A 12-month contribution calendar whose day cells can be reached and read by keyboard
- A technology profile measured in bytes of code across original repositories
- An activity score combining contributions, stars, and recently updated repositories
- A searchable, sortable repository table
- A shareable URL and share preview for every profile
- Loading, empty, and error states, including rate limits
What’s next
- Read contributions through GitHub’s GraphQL API, removing the dependency on the profile page’s markup.
- Compare two profiles side by side.